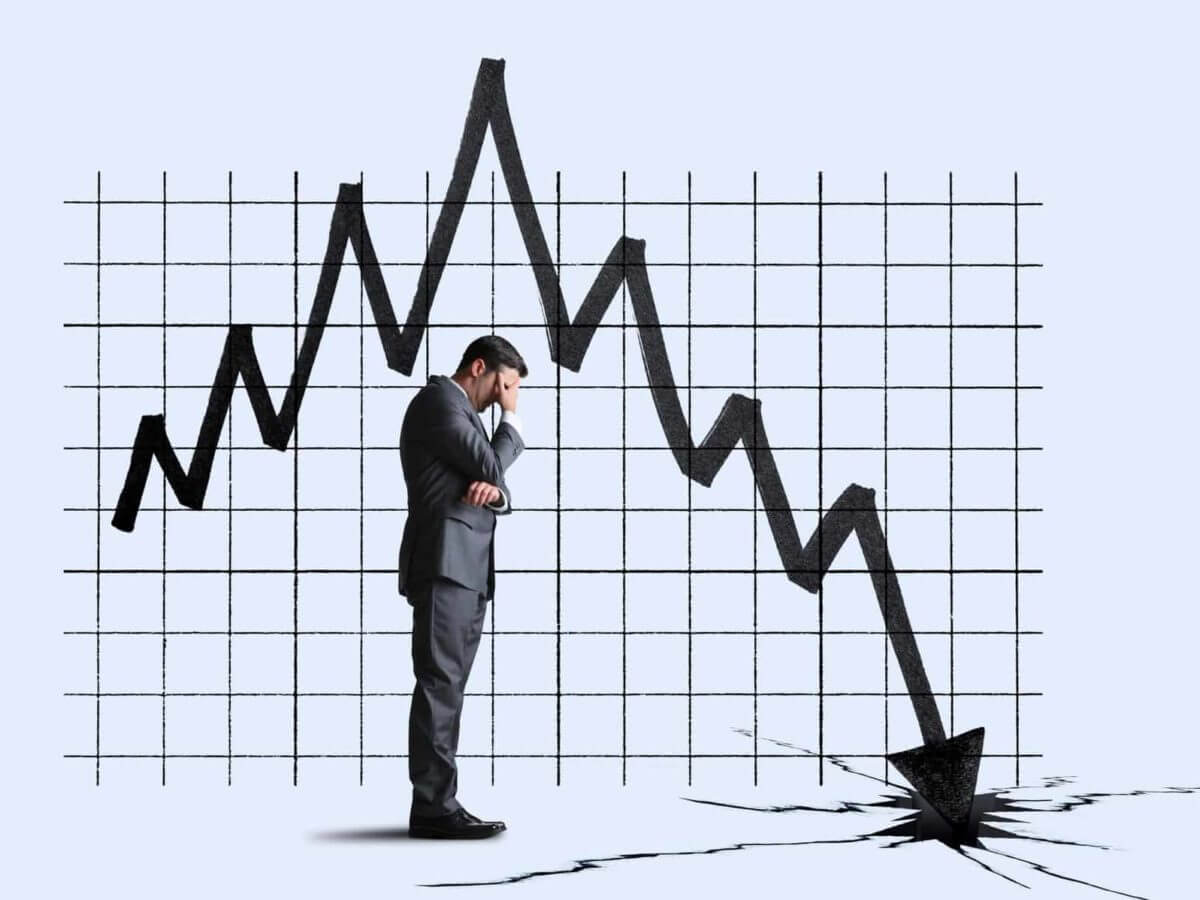
While the stock market is often viewed as a pathway to long-term wealth, zooming in on its immediate trajectory reveals a lack of predictability in directional moves. Despite the excitement surrounding the current bull market, indices like the Dow Jones Industrial Average (DJINDICES: ^DJI), S&P 500 (SNPINDEX: ^GSPC), and Nasdaq Composite (NASDAQINDEX: ^IXIC) have oscillated between bear and bull markets since 2020. As 2024 unfolds, there’s a looming possibility of another downturn, potentially sending stocks plunging once more.

While no single indicator or economic data point can accurately predict short-term market movements, certain metrics have historically correlated strongly with stock market trends. One such indicator with an impeccable track record is the Conference Board Leading Economic Index (LEI), renowned for its ability to forecast U.S. recessions.
The LEI, reported monthly, comprises 10 inputs, including financial and nonfinancial variables such as stock market performance and manufacturing data. Designed to predict changes in the business cycle, the LEI aims to anticipate recessions before they are officially declared by the National Bureau of Economic Research.
Recent data reveals concerning trends, with the LEI experiencing its 22nd consecutive monthly decline in January 2024, marking the second-longest contraction period since 1959. Of particular significance is the year-over-year decline, with the LEI down 7% from the previous year, a level historically associated with impending recessions.
While stock market performance doesn’t perfectly mirror economic conditions, indicators like the LEI offer valuable insights for investors. Historically, extended periods of market exuberance, as reflected in elevated valuation metrics like the Shiller P/E ratio, have often preceded significant downturns.
The Shiller P/E ratio, based on average inflation-adjusted earnings over the past decade, has recently surpassed 34, a level historically associated with market corrections. Despite not serving as a precise timing tool, prolonged periods of high valuations have typically preceded substantial market declines.
Despite these warning signs, there’s reassurance in understanding the broader historical context of market cycles. While economic contractions are inevitable, they tend to be temporary, with periods of expansion far outweighing downturns. Similarly, despite market volatility, historical data demonstrates the resilience of long-term investments, with every rolling 20-year period in the S&P 500 yielding positive returns.
In navigating the uncertainties of the market, patience and perspective remain invaluable. Understanding historical patterns and maintaining a long-term investment approach can help investors weather market fluctuations and capitalize on opportunities for wealth creation.