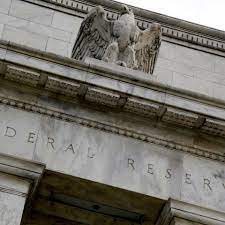
The latest revisions from the Commerce Department revealed that the Federal Reserve’s core PCE price index, a key inflation measure, has dipped to a 2% annualized rate in the third quarter. The unexpected softening of inflation data, coupled with upcoming November inflation figures, contributed to a rally in the S&P 500 and a decline in the 10-year Treasury yield.
The subdued inflation reaching the Fed’s 2% target in Q3, despite robust economic growth, provides insight into policymakers’ reduced concerns about an inflation resurgence.

Growing Odds of Fed Rate Cut: Financial markets are now placing bets on the Fed cutting its key policy rate to 3.8% by the end of 2024, a decrease from the previous estimate of 3.83%. The diminishing inflation has made the current 5.25% to 5.5% range of the federal funds rate appear increasingly restrictive. Market pricing indicates an 83% probability of the first rate cut occurring at the March 20 meeting, up from 79% on Wednesday. Furthermore, markets now foresee a 42% chance of a 1.75 percentage point rate cut next year, an increase from 38% a day ago.
Real Federal Funds Rate and Monetary Policy Tightness: The real federal funds rate, representing how much the key interest rate exceeds the inflation rate, was between 3.25% and 3.5% in Q3, surpassing the Fed’s long-term estimate of the neutral policy rate. This rate is one that neither restricts growth nor boosts it.
November PCE Inflation Data: The consumer price index for November showed a 0.3% rise in core prices, while the producer price index suggested a softer reading for the core PCE price index, aligning with Fed Chair Jerome Powell’s dovish outlook. Forecasts anticipate a 0.2% rise in core prices, potentially lowering the annual core PCE inflation rate to 3.4% from October’s 3.5%.
Economic Indicators and Market Impact: Despite the GDP for Q3 being revised down to 4.9% from the prior estimate of 5.2%, the S&P 500 rallied by 0.6% in Thursday’s morning stock market action. The 10-year Treasury yield, a key factor for stock valuations, fell to 3.83%, last seen in late July.
Jobless Claims and Economic Trends: Recent data on jobless benefits showed a marginal increase to 205,000 in the week through December 16. This follows a trend of disinflation alongside solid economic growth in Q4.
S&P 500 and Treasury Yield Dynamics: The S&P 500’s upward trajectory, with a 16% rally since October 27, has coincided with a significant drop in the 10-year Treasury yield. Analysts utilize the 10-year yield as the risk-free rate for discounting the present value of future earnings.
In summary, the interplay of economic indicators, inflation data, and market dynamics is shaping expectations of potential Fed rate cuts and influencing key financial markets.


